Annotation Metrics
You may be interested in calculating metrics over your annotations to get a grasp of the quality. It might be that your annotators don’t agree with each other and this disagreement can be captured and tracked with a statistic. To help make this easy, Prodigy implements a few of inter-annotator agreement (IAA) metrics that you can apply to your annotated datasets. This guide helps to understand how to use these metrics by explaining the syntax as well as the underlying principles behind the annotation statistics.
Quickstart
I want measure IAA over binary accept/reject annotations.
You can use the metric.iaa.binary to measure IAA over any annotations
that consist of accept/reject decisions. The only dataset requirement is that
the annotations are stored under the key answer and all annotations have been
completed with the same _view_id. It’s also important to know that the
agreement is measured on tasks grouped by the _input_hash.
You can learn more by checking the binary annotations section on this page.
I want measure IAA over document level annotations with exclusive labels.
If your data was annotated using choice interface with multiple
exclusive labels you can use the metric.iaa.doc with multiclass
parameter to compute IAA metrics. It is required that the annotations are stored
under the accept key and that all annotations have been completed with the
same view_id. It’s also important to know that the agreement is measured on
tasks grouped by the _input_hash.
You can learn more by checking the multiclass annotations on this page.
I want measure IAA over document level annotations with non exclusive labels.
If your data was annotated using choice interface with with multiple
non exclusive labels i.e. each object can have more than one label, you can
use the metric.iaa.doc with multilabel parameter to compute IAA
metrics. It is required that the annotations are stored under the accept key
and that all annotations have been completed with the same view_id. It’s also
important to know that the agreement is measured on tasks grouped by the
_input_hash.
You can learn more by checking the multilabel annotations on this page.
I want measure IAA over token or span level non-binary annotations.
If your data was annotated using ner_manual or spans_manual
interface, you can use the metric.iaa.span to compute IAA metrics. It is
required that the annotations are stored under the spans key and that all
annotations have been completed with the same view_id. It’s also important to
know that the agreement is measured on tasks grouped by the _input_hash.
Measuring inter-annotator agreement
When multiple users annotate a dataset, you should check that the annotators agree before training a machine learning model. Without agreement, it’s hard to argue that there is a ground truth to learn from. There are many reasons why your annotators may disagree. The task may be ambiguous, the examples may be interpreted in many ways or there might be time pressure.
In any of these cases the annotators won’t agree and that’s an indication that there’s a problem with the annotation process that should be adressed. This is why you’re typically interested in measuring the agreement between annotators; it gives you a signal that you can act on. While the metrics may not tell you what the issue is, they can indicate that there is an issue.
Typically, calculating IAA metrics starts during the project’s early stages. This helps to fine-tune the annotation guidelines and provide additional guidance to annotators. Through several iterations, you’ll choose a representative portion of your dataset, assess agreement metrics within this subset, make guideline refinements, and repeat this process until the metrics are satisfactory. This ensures that a shared understanding of the annotation guidelines is established, allowing annotators to confidently proceed with annotating the remainder of the dataset:

Maintaining a consistent practice of continuously assessing IAA is advisable for long-term projects. This can be achieved by periodically providing a subset of overlapping examples to your annotators and ensuring that the metrics remain stable and consistent throughout the duration of the project.
A few conditions should, minimally, be met in order to compute reliable inter-annotator agreement metrics (Artstein 2017):
- The annotators should follow the annotation guidelines to make sure their output is consistent and reproducible.
- The annotators should work independently as groupthink will likely obfuscate any potential issues with the annotation schema or the interpretation of the data leading to unfairly high agreement scores.
- The annotators should be sampled form a well defined population to understand better their interpretation of the guidelines (and the data)
- The subset of the data used for IAA calculation should be representative of the corpus to be annotated in terms of data types and categories.
Before diving into metrics it’s also good to remind yourself that metrics deserve to be taken with a grain of salt too. A metric is just a number that tries to make a summary and they typically doesn’t capture everything that might go wrong in an annotation proceess. You really want to prevent that a metric becomes a target.
Annotator agreement can be tricky
To help explain why metrics always deserve context, it may help to consider an extreme example. Let’s suppose that you’re working on a text classification problem that has a rare class. Maybe you’re working on detecting newspaper articles about fraud at argicultural companies.
Odds are that most articles won’t be about this topic, maybe only 1% of all the articles would qualify. Let’s now assume that we have one annotator who is always correct and another annotator that always claims that the article isn’t about the label of interest. Then in that case, if we just measure how often annotators agree, it’ll be easy to report a 99% agreement score. This number might seem very high, which might suggest that your annotation process is “just fine”. Despite the fact that the annotators disagree when it matters!

One part of this problem is that raw accuracy scores may not be a useful metric, but a more general bit of advice is to always consider that metrics are just that. They might provide you a hint that can inspire an improvement, but they aren’t able to capture everything that you might be interested in.
IAA metrics for document level classification
Various quantitative methods exist to assess inter annotator agreement (IAA), with the most commonly reported metrics in the literature being the Kappa metrics, such as Cohen’s Kappa and Fleiss’ Kappa, and Alpha metrics, notably Krippendorf’s Alpha. All of these metrics share the general form in that they take into account both the observed agreement (pₐ) - the proportion of instances where annotators agree and the expected agreement (pₑ) the agreement that would occur by chance:

This way, they return a more normalized value that quantifies agreement beyond random chance. The main difference between these metrics is in how the expected agreement is computed and the type of data and annotation scenarios they can handle.
Cohen’s Kappa is probably one of the most widely reported IAA metrics. However, it requires a complete overlap between annotators and it doesn’t scale to more then two annotators or large category sets. For this reason we have opted for a combination of 3 different metrics i.e.
- Percent (Simple) Agreement
- Krippendorf’s Alpha
- Gwet’s AC2
Percent (Simple) Agreement
Percent (Simple) Agreement is a basic IAA metric which is a percentage of cases in which annotators provide the exact same label for a given object.

It’s very simple to compute but its main limitation is that it doesn’t take into account chance agreement and can be unfairly high when evaluating datasets with sparse phenomena (as illustrated in the example above). It is useful for evaluating equally distributed phenomena and as a sanity check in combination with other metrics.
Krippendorff’s Alpha
Krippendorff Alpha is a chance corrected measure of IAA that is often used as an alternative to Cohen’s Kappa because it:
- can be generalized to cases with more than two annotators
- can handle missing or incomplete data and so it can be applied to partially overlapping annotations
- applies to any measurement level i.e. nominal, interval and ratio (when used with nominal data it is equivalent to Fleiss’ Kappa)
- allows different weights to be assigned to different categories or levels of agreement (in Prodigy, since we deal with nominal data, we use the identity weighting i.e annotations are either the same or different)
The implementation of the metrics used in Prodigy IAA recipes
metric.iaa.doc and metric.iaa.binary is based on
Gwet (2015)
and is ported from Peter Baumgartner’s
GitHub repository.
Please consult the
paper for a
detailed walkthrough.
Gwet AC2
Gwet AC2 (as discussed in Gwet 2015) is an alternative coefficient which, apart from having all the properties listed for the Krippendorff Alpha, it is specifically designed to address the limitations of Cohen’s Kappa: the tendency to underestimate coefficient for high chance agreements and lack of robustness against imbalanced categories.
The general form of Gwet AC2 is similar to Krippendorff’s alpha:

Similar to Krippendor’s alpha, (pₐ) and (pₑ) are weighted estimates of agreement, however for the computation of (pₑ), AC2 takes into account all annotators, not only the ones who have annotatated 2 or more examples. For details on computing AC2 please consult Gwet 2015.
IAA interpretation
Interpreting agreement metrics is difficult as there are many hard to control factors at play that may affect the results such as latent patterns in the data or the task structure, obscure differences between the annotators etc. For this reason it is always recommended to understand well the assumptions behind the selected metrics which determines how useful they are for a given task.
As a rule of thumb, the three metrics should correlate. If that is not the case, it is recommended to increase the the number of coincident examples and/or inspect your data for uneven distribution of categories.
The target value of IAA is not an exact science either. It ranges from -1 to
1, where 1 signifies perfect agreement and 0 denotes chance agreement. If
the value is negative it means that there is less agreement than expected by
chance. In literature 0.8 is usually considered an reliable IAA (cf. Artstein
et al. (2017) for a detailed discussion of the values). In practice, you would
usually develop a sense of a good metric for your project once you have trained
initial models and observe how the IAA metric and model performance correlate
with respect to the data and task at hand.
Please note that we use the identity weighting when doing pairwise comparisons of the annotations i.e. the annotations can either be the same or different, which makes Krippendorf’s Alpha equivalent to Fleiss’ Kappa.
Input annotations
Three types of document level annotations are supported by the Prodigy IAA commands: binary, multiclass and multilabel. There are certain expectations with respect to the data structure of the annotation task that depend on the type of annotation (see below). All IAA commands require that:
- All annotation examples should have an
_input_hashassigned. The pairs of annotations to compare are selected based on the_input_hash. If your data doesn’t have the_input_hashset, Prodigy will assign one automatically based on the value of the input field i.e. text, image, audio. html etc. (in which case you’ll see a warning in terminal). - They should also contain the
_annotator_idattribute which is added automatically by built-in Prodigy recipes used in multiuser scenarios (it is a concatenated dataset name and the annotator ID provided as part of the URL in multiuser annotation workflows). - All examples must be generated with the same
_view_idto ensure that the annotators have been exposed to the same annotation task.
These requirements are very similar to the requirements for the review
recipe. You can check the review section for the
in-depth guide that explains some of the details behind these requirements.
Binary
Binary document level annotations are used when annotators assign a single label to text, image or another object:
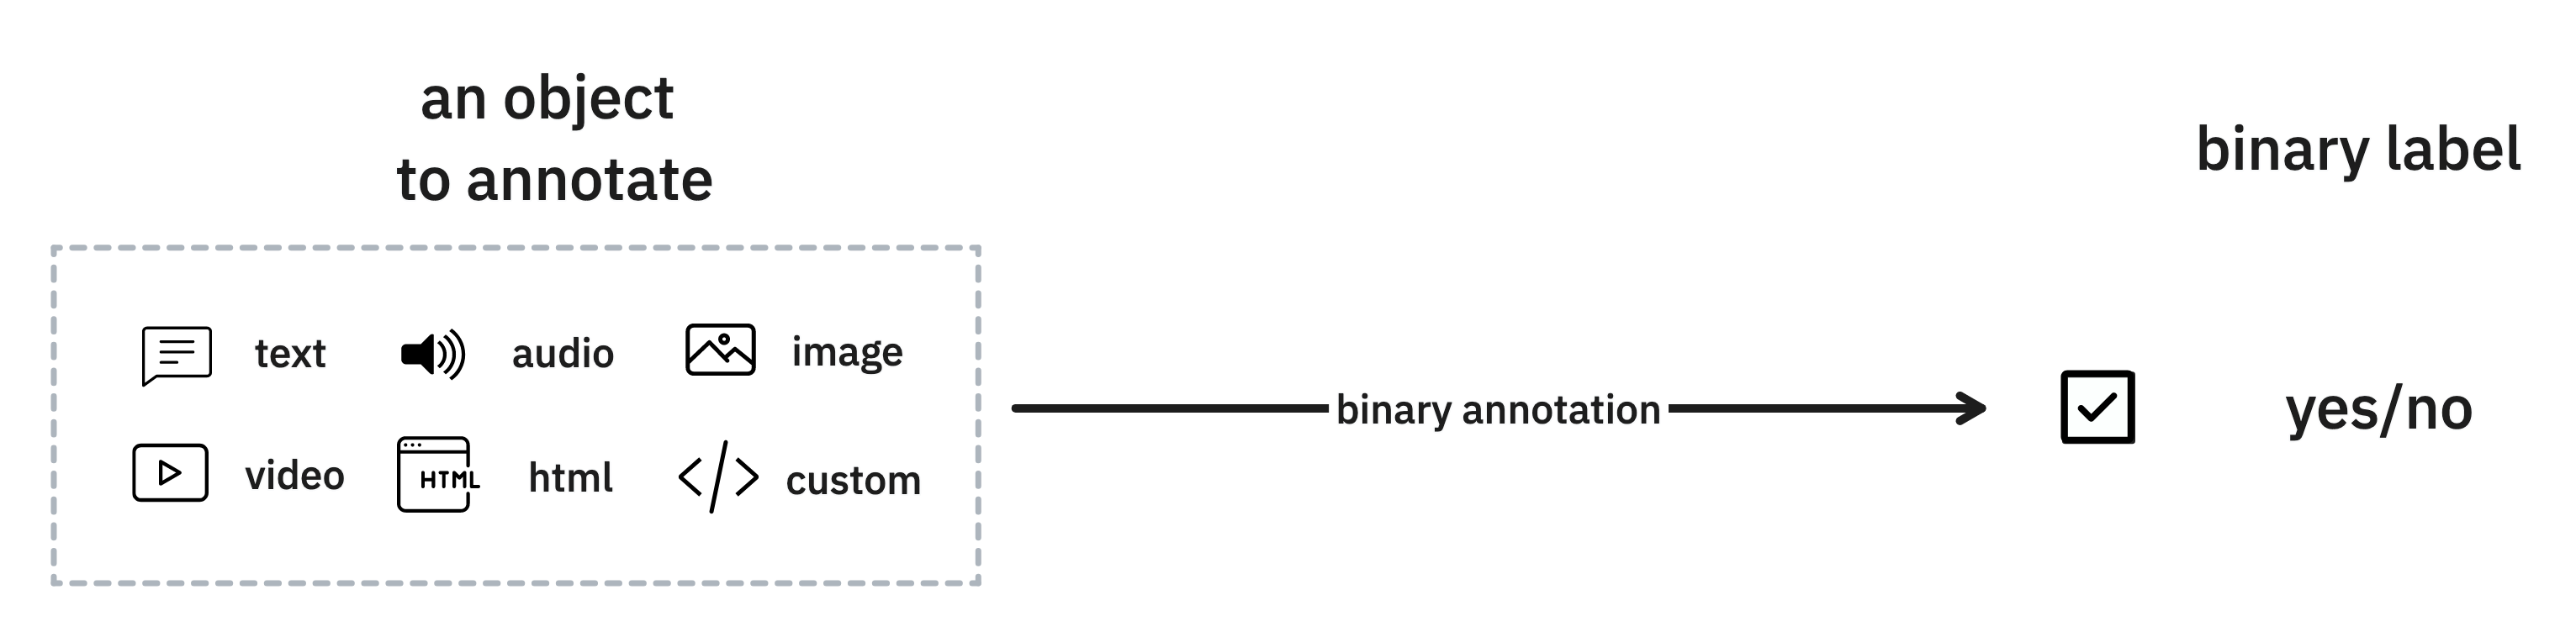
Typically, binary annotations are generated by recipes such
textcat.manual, audio.manual, image.manual when they are
used with just one label. Or when the annotators only accept or reject
annotations generated otherwise e.g. with the help of an LLM. In these cases,
the relevant information is stored under the answer key in the annotation task
and this is the value (accept, reject or ignore) that is being taken into
account when computing the IAA metrics with the metric.iaa.binary
command. Please not the metric.iaa.binary can also be used with span
annotations (e.g. NER or spancat).
Multiclass
Multiclass annotations are typically the result of annotations completed with
the choice interface when users can assign a single label from a
selection of exclusive choices.
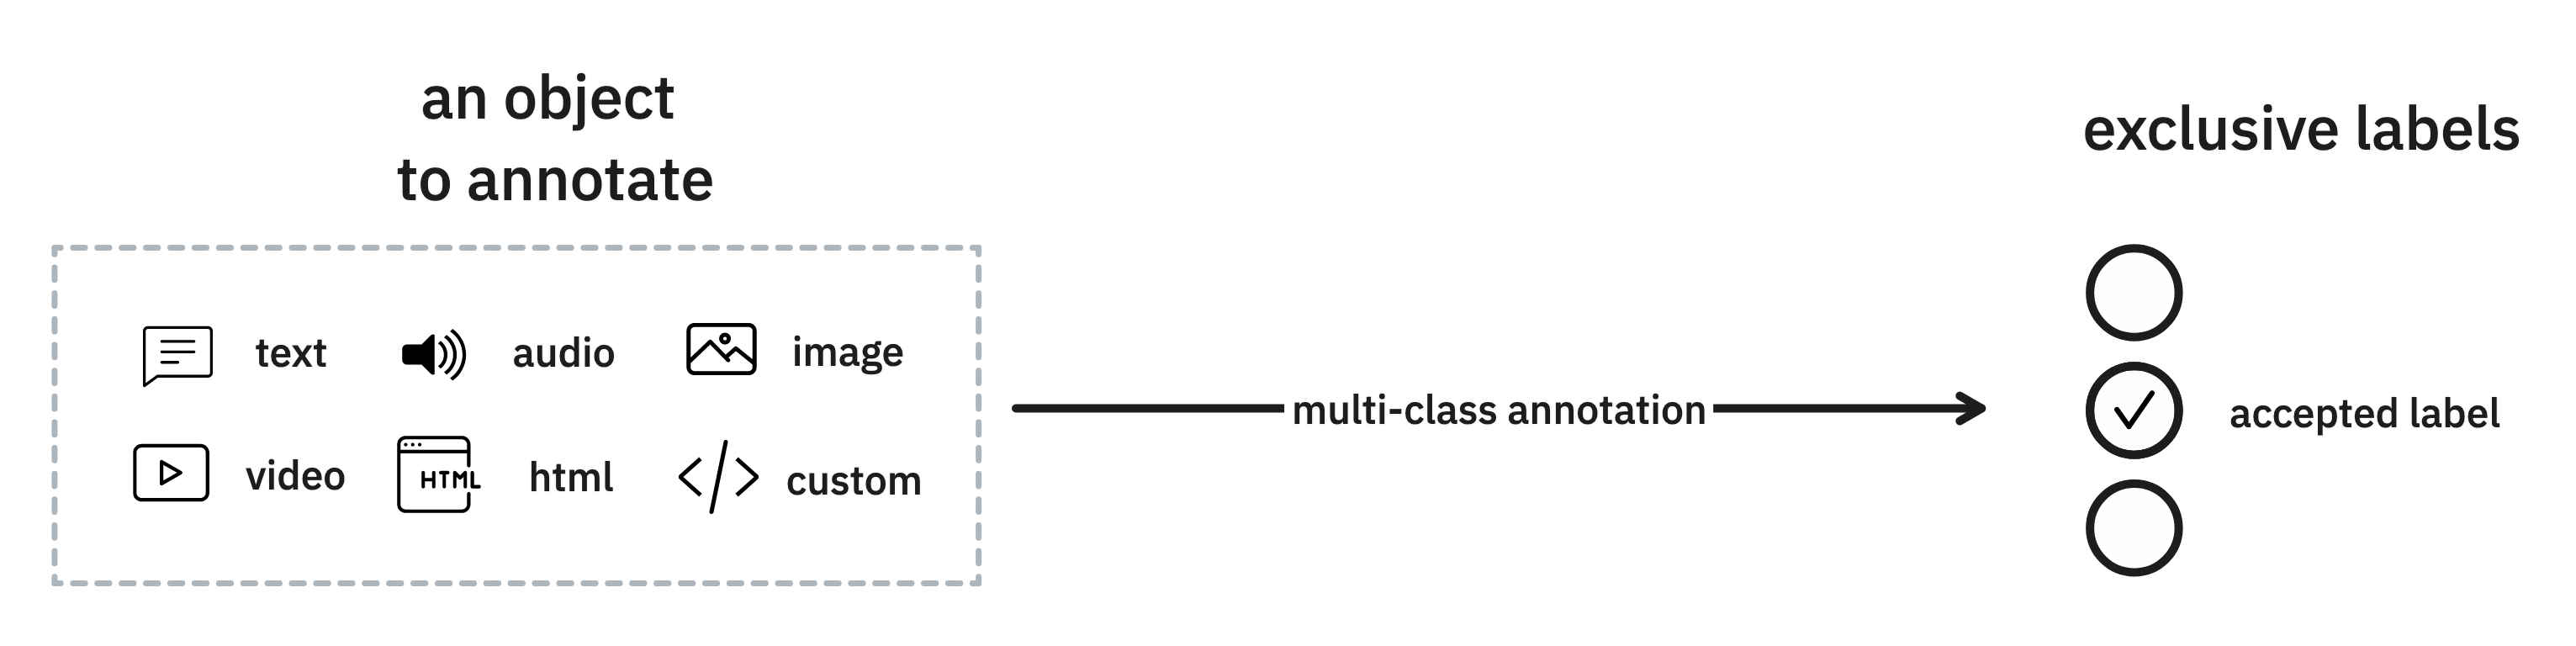
In this case the relevant value for the computation of the IAA is stored under
the accept key, where only one value is expected. If an example containes
more that one value in the accept list, an error will be raised if the recipe
is called with the multiclass annotation_type parameter:
The labels and `annotators“ arguments are optional and if they are not
provided they will be collected from the the dataset. If they are provided, they
will be validated against the labels and annotators in the dataset. Both
arguments can be used the define the subset of labels or annotators to be
included in the analysis.
Multilabel
Multilabel annotations for an object assign one or more labels from a selection of non-exclusive labels.
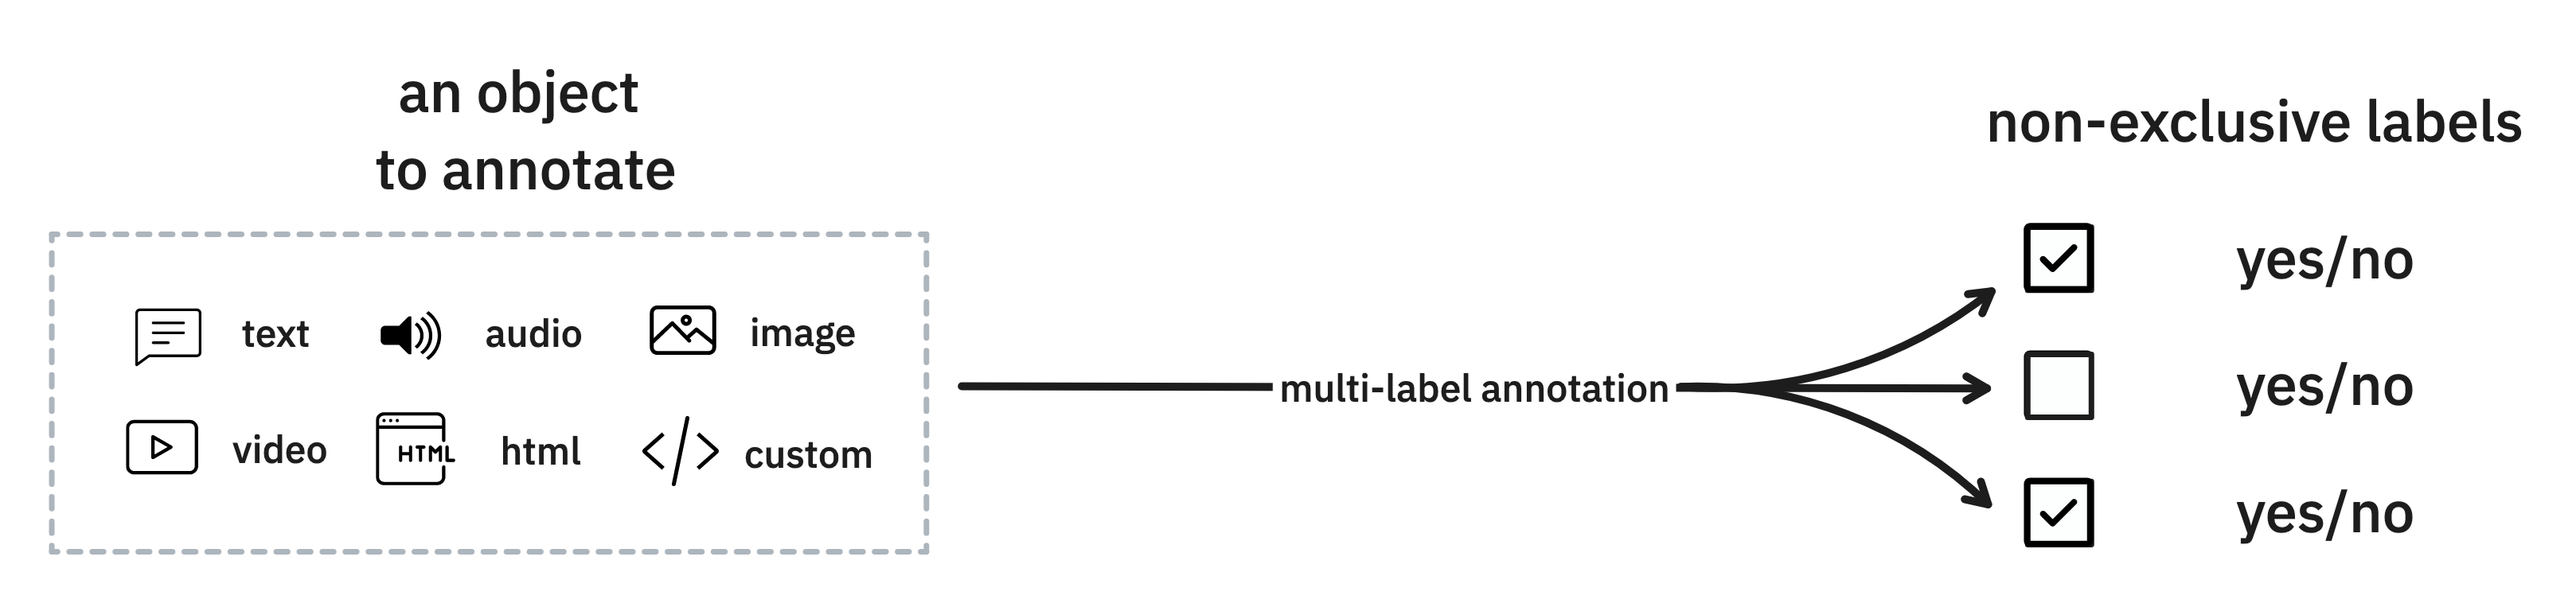
In this case, the annotations are also stored under the accept key, but
multiple labels are expected. To compute IAA metrics for a multilabel
scenario, iaa.metric.doc should be called with the multilabel
annotation_type parameter:
Under the hood, the multilabel scenario handles each label separately as if it
was a binary case and reports separate metrics per label. Similarly to
multiclass scenario, the labels and annotators are optional and will be used
for validation if provided.
IAA doc output
All Prodigy IAA commands produce the following output to the terminal (the
multilabel variant provides separate Agreement Statistics per label):
These results can also be stored on disc as a json file, if the --output
option is specified. A possible interpretation could be that given the low
number of coincident examples (just 17 examples) Krippendorff’s Alpha and Gwet’s
AC2 should be consired unreliable. For this dataset Percent Agreement is
probably the most telling metric assuming there the distribution of categories
is not heavily skewed. The IAA agreement can be considererd too low to accept
this dataset for training and the error analysis e.g. using Prodigy
review recipe is recommended.
IAA metrics for token level classification
Computing IAA for token-level annotations is a bit trickier than document level classification. This is because there are many potential spans that could be annotated and these spans could overlap while not overlapping fully. This makes it much harder to re-use the concepts of observed and chance probabilities required by Alpha and Kappa statistics.
For token-based annotations, notably NER but any other span based annotations, the recommended metric is the average pairwise F1 score (Hripcsak & Rothschild, 2005). F1, as opposed to Kappa (and similar) statistics, does not require a precise definition of negative examples. Furthermore, pairwise F1 has similar properties to document-level metrics in that it generalizes to multiple annotators and multiple classes and labels.
One more important consideration is the definition of a match. When you’re dealing with spans, should only perfect matches be counted as agreement or is it permitted to count partial matches as agreement as well? Also, should we consider span matches and label matches separately or consider only “concept matches” whereby both span and label match perfectly?
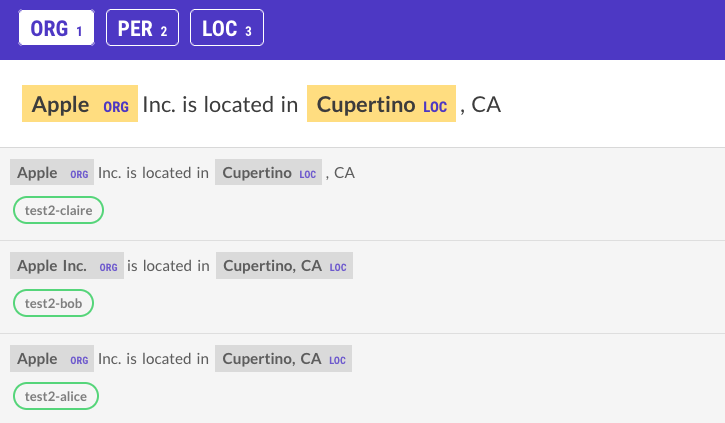
In Prodigy, by default, we adopted the “concept match” approach for the definition of a perfect match i.e. both span and label must match to consider an example as true positive. For a partial match to be counted as a true positive, the compared spans must overlap on at least one token and the label must match as well. In the following example, with partial matches allowed, Alice’s and Claire’s annotations would have been considered as equal to Bob’s annotation.
With strict matches, however, Clare would have 2 false positives and 2 false negatives, while Alice would have 1 true positive, 1 false positive and 1 false negative.
In iaa.metric.span the user can specfy the partial flag to accept
partially overlapping spans as well as more strict default. It is useful to
compare the scores bewteen partial and stric conditions. A big difference might
indicate that the annotators have troubles detecting the boundaries of the
entities/spans.
Pairwise F1 agreement
Pairwise F1 agreemant is an adaptation of the standard information retrieval metric F1-score for assessing agreement between annotators.
For each pair of annotators, we treat one annotator’s data as experiment and the other annotator’s data as gold truth and compute precision, recall and F1 based on that. Then, to get the final F1 score, all pairwise F1 scores are micro-averaged. To illustrate this better, let’s consider how the metrics are computed for a single overlapping example above. Assuming the full match constraint, the confusion matrix for Bob (gold standard) and Alice (experiment) would look like this:
| PER | ORG | LOC | NONE | |
|---|---|---|---|---|
| PER | 0 | 0 | 0 | 0 |
| ORG | 0 | 0 | 0 | 1 |
| LOC | 0 | 0 | 1 | 0 |
| NONE | 0 | 1 | 0 | 0 |
There’s no corresponding complete match to Apple in Bob’s annotation, which is
why we increase the count of the ORG-NONE cell. Conversly, Bob’s Apple Inc can
be considered a false negative from Alice’s perspective.
Note that with the partial match, we would give credit for the overlapping tokens:
| PER | ORG | LOC | NONE | |
|---|---|---|---|---|
| PER | 0 | 0 | 0 | 0 |
| ORG | 0 | 1 | 0 | 0 |
| LOC | 0 | 0 | 1 | 0 |
| NONE | 0 | 0 | 0 | 0 |
Using the full-match table above, we can now compute the pairwise F1 score for Alice and Bob:
True Positives (TP) = 1False Positives (FP) = 1Note: we includeNONEin the sum as this is a relevant error for NER.False Negatives (FN) = 1Precision(P) = TP / (TP + FP) = 1 / 2 = 0.5Recall (R) = TP / (TP + FN) = 1 / 2 = 0.5F1 = 2 * (P * R) / (P + R) = 2 * (0.25) / 1 = 0.5
Once the example pairwise scores have been computed for all the overlapping examples, we would compute a pairwise score for each pair of annotators. As a final step, the pairwise scores need to be micro-averaged to compute the final score.
Apart from the global scores, Prodigy metric.iaa.span also reports
metrics per class and the normalized global confusion matrix, which can be
useful to asses whether there are any pairs of labels that are particularly
confusing. The recipe outputs the results to the terminal and, optionally,
stores them on disc as a json file.
The assumptions with respect to input data are the same as for document level metrics and can be consulted here.